

Welcome to the 913 new Bottleneck readers who have joined us since the last edition! If you haven’t subscribed, join 22,436 COOs and operation nerds by subscribing here:
Hi Operators ⚙️
Today, we're exploring AI workflows for quickly getting insights and visualizations out of your data. No more fumbling around in 100k+ spreadsheet rows 🥴
Here’s what we’ve got going on:
You Need a Prompt Database → Keep your AI workflows organized.
Get a “Tour” of Your Data → A prompt for initial data insights.
Data Visualization in 90 Seconds → ChatGPT can do that?
Ready? Let’s dive in 👇
P.S. Building a business can be lonely. Let’s connect on Linkedin

PRESENTED BY CORNERSTONE
It’s not just what you learn, it’s who you learn from.
But we get it—operations can be lonely. You’re handling the backend so your company can thrive, but there’s rarely anyone to bounce ideas off of or share war stories. That’s why we’ve created Cornerstone,
Cornerstone is a membership designed to provide you with the support and insights you need to lead confidently, scale your business, and tackle the unique challenges that come with building high-performing teams.
Click down below to see if you qualify.

Operator’s Library
Explore the cutting edge of data storytelling with these incredible visualizations (The Pudding)
Get immediate insights about your data with this AI-powered analysis tool (Julius)
Transform raw numbers into compelling visuals with this custom GPT (ChatGPT)
Join an admittedly-nerdy community of data analysts experimenting with new datasets every week (Tidy Tuesday)
Why your data deserves the same love as your flagship products (HBR)

I. You Need a Prompt Database
Insight from Rameel Sheikh
We’ve been sharing a lot of AI prompts lately.
And, if you’re anything like me, you waste a ton of time searching through old newsletters and ChatGPT conversations digging up prompts that you’ve seen or used before.
Sound familiar?
If so, you should do what I did and build a “prompt database.”
No more rewriting prompts from scratch or searching through your chat histories. The goal is to get all of the time-saving prompts you’ve ever leveraged, organized and in one place 😍
Using a tool like Notion or Airtable, create a home for templatized versions of all of your go-to AI prompts:
Categorize prompts by department or task type (e.g., marketing, customer service, product development).
Include fields for the prompt text, intended use, date it was last updated, and any specific instructions.
Set up a quick form for team members to submit new prompts they've found effective.
The concept is simple. The alpha is in consistently using and updating it.
If you really want to get fancy with it, create a Slack command that lets team members quickly search and retrieve prompts right where they work.
Now, let’s get you some first prompts to throw in there…
II. Get a “Tour” of Your Data
Insight from Enrico Bertini
The key to powerfully presenting data is having a good story (remember? 😉)
But when you first take a look at a brand new 100,000 row spreadsheet of data, the only story you’ll want to pull out of it is one where you log-off and catch an early night.
So, we either can spend an hour formatting and organizing that data, OR we can get our AI intern to do the leg work.
Let’s ask ChatGPT to give us a comprehensive “tour” of the data to get the juices flowing. (Don't be a weirdo… please use the 4o model)
Upload the data you want to analyze along with the following prompt 👇
"Analyze this dataset and provide a focused tour. Detect significant trends, anomalies, or changes over time. Compare different strategies or segments present in the data. Evaluate any new initiatives or tests.
From your analysis, create three strategic stories for a board presentation. For each story:
Setup: Describe the initial situation.
Conflict: Identify a key change, challenge, or opportunity in the data.
Resolution: Explain how to address the conflict or capitalize on the opportunity.
Ground each story in specific data points, focusing on strategic implications for growth, efficiency, or innovation.
Based on these stories and your overall analysis, offer three specific, data-backed recommendations to improve performance. Lastly, point out any potential missed opportunities or areas for expansion evident from the data.
Keep the entire analysis concise and tailored for a board audience."
Boom.

Just like that, we have initial insights and stories we can create data visualizations for.
Speaking of which…
III. Data Visualization in 90 seconds
Insight from Rameel Sheikh
Now, let’s create a visualization to help us communicate the stories we got from that last output.
Start with this prompt:
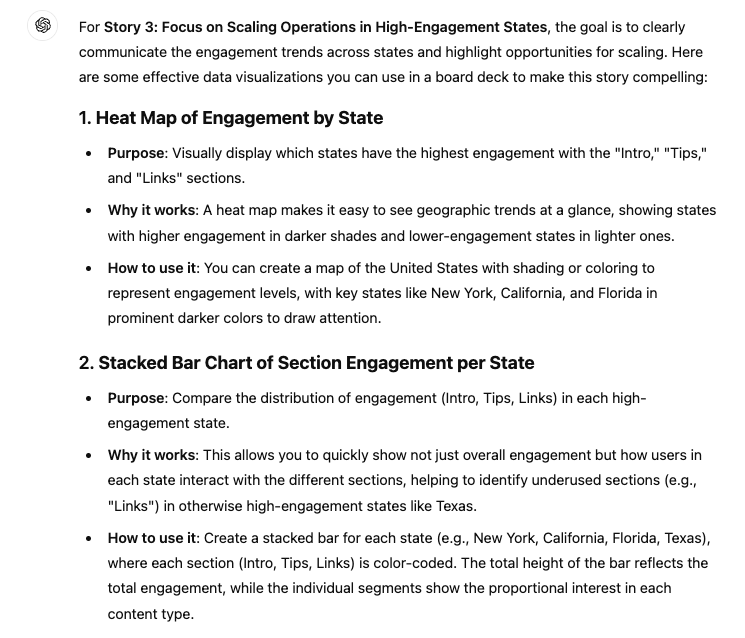
“What are some effective data visualizations I can leverage to communicate [STORY FROM LAST OUTPUT] in a board deck?”
That should get you an output like this 👇
Now comes the cool part 😎
From here, we can pick one of these options and actually have ChatGPT create the chart for us.
Not only that, but we can switch to an interactive version of the chart that gives us greater flexibility on the design of the chart and the data displayed.
Once we have the chart designed just the way we want, we can download the image straight from ChatGPT and throw it right in the deck.
Using this workflow, we can go from raw CSV to useful, story-driven visualizations in a little less than 3 minutes (we timed it).
Don’t say we never showed you anything useful 😉

Help me help you

How am I doing? 👋
I take all feedback I receive to heart. Keep it coming! Just hit reply and let me know – I'd love to hear from you!
Cheers,
Rameel from The Bottleneck

Spread The Word
If you learned something today, I’d appreciate you forwarding this to a friend. It’ll take you 8 seconds. It took us 15 hours to write today’s edition.