
Insight from Scott Berinato
Okay, so now you’ve got a better variety of charts in your arsenal.
But guess what? Those charts aren’t going to convince anyone of anything without a good story behind them.
You can pay a McKinsey consultant $800/hr to tell that story, or you can learn to tell one yourself.
Let’s save you that $500k with a simple framework to get you started.
All you need are three acts: a setup, a conflict, and a resolution.
It worked when we started telling stories ~300,000 years ago, and it still works today.
A very simple example:
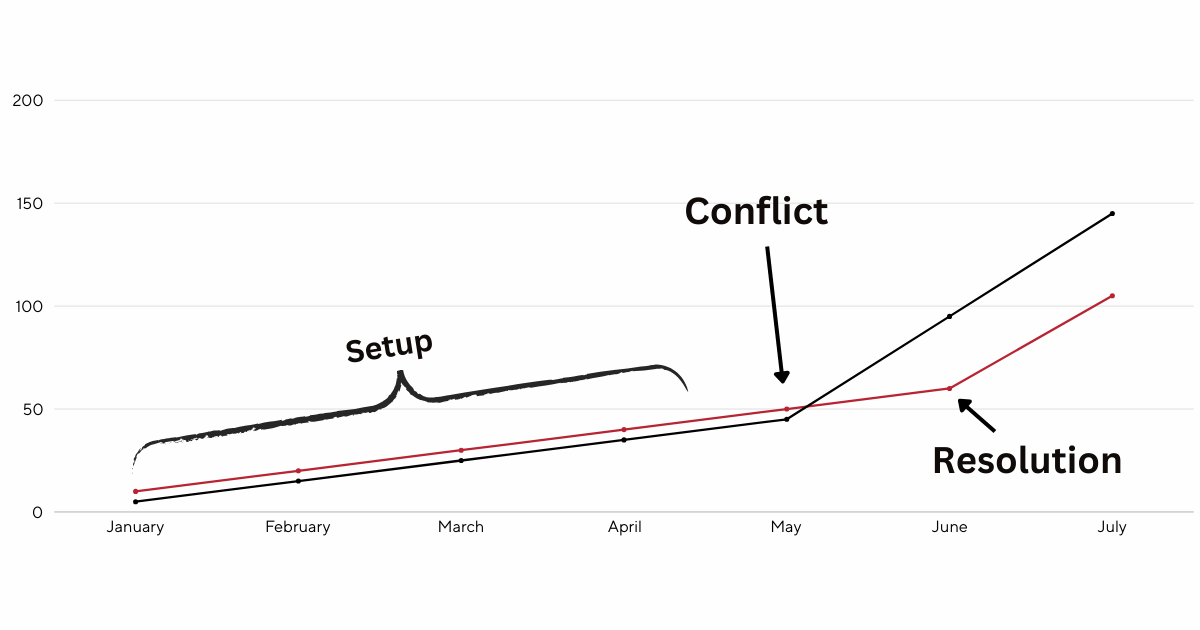
The Setup (the situation as it was - “the status quo”): For the last 10 months, we’ve been building widgets at the same rate as our competitor 😀
The Conflict (a change in the status quo, something is different now!): In May, our competitor unlocked a new widget building method 😞
Resolution (how we’re addressing the conflict): This month, we figured out a similar technology, and we’re building widgets at the same rate again! 😀
The better you get at identifying these three concepts, the better you get at telling stories with the data at your disposal.
Next time you’re putting together a slide, consciously note the setup, conflict, and resolution of the story you’re trying to tell.
Learn more: How to effectively tell a story with data